
dashboard1999
BH Information Service Co. Ltd. uses the open data of “Kaohsiung City Government 1999” to construct a service system visually.
This service system uses a line chart to present the real-time reported cases of the day, and combines the map heat sensitivity to observe the density of reported cases in the area.
The report overview updates the reported cases in real time, reflecting the progress of the case (color block on the left), and then calculates the deregulation rate of the case on the day based on the completion of the reported case.
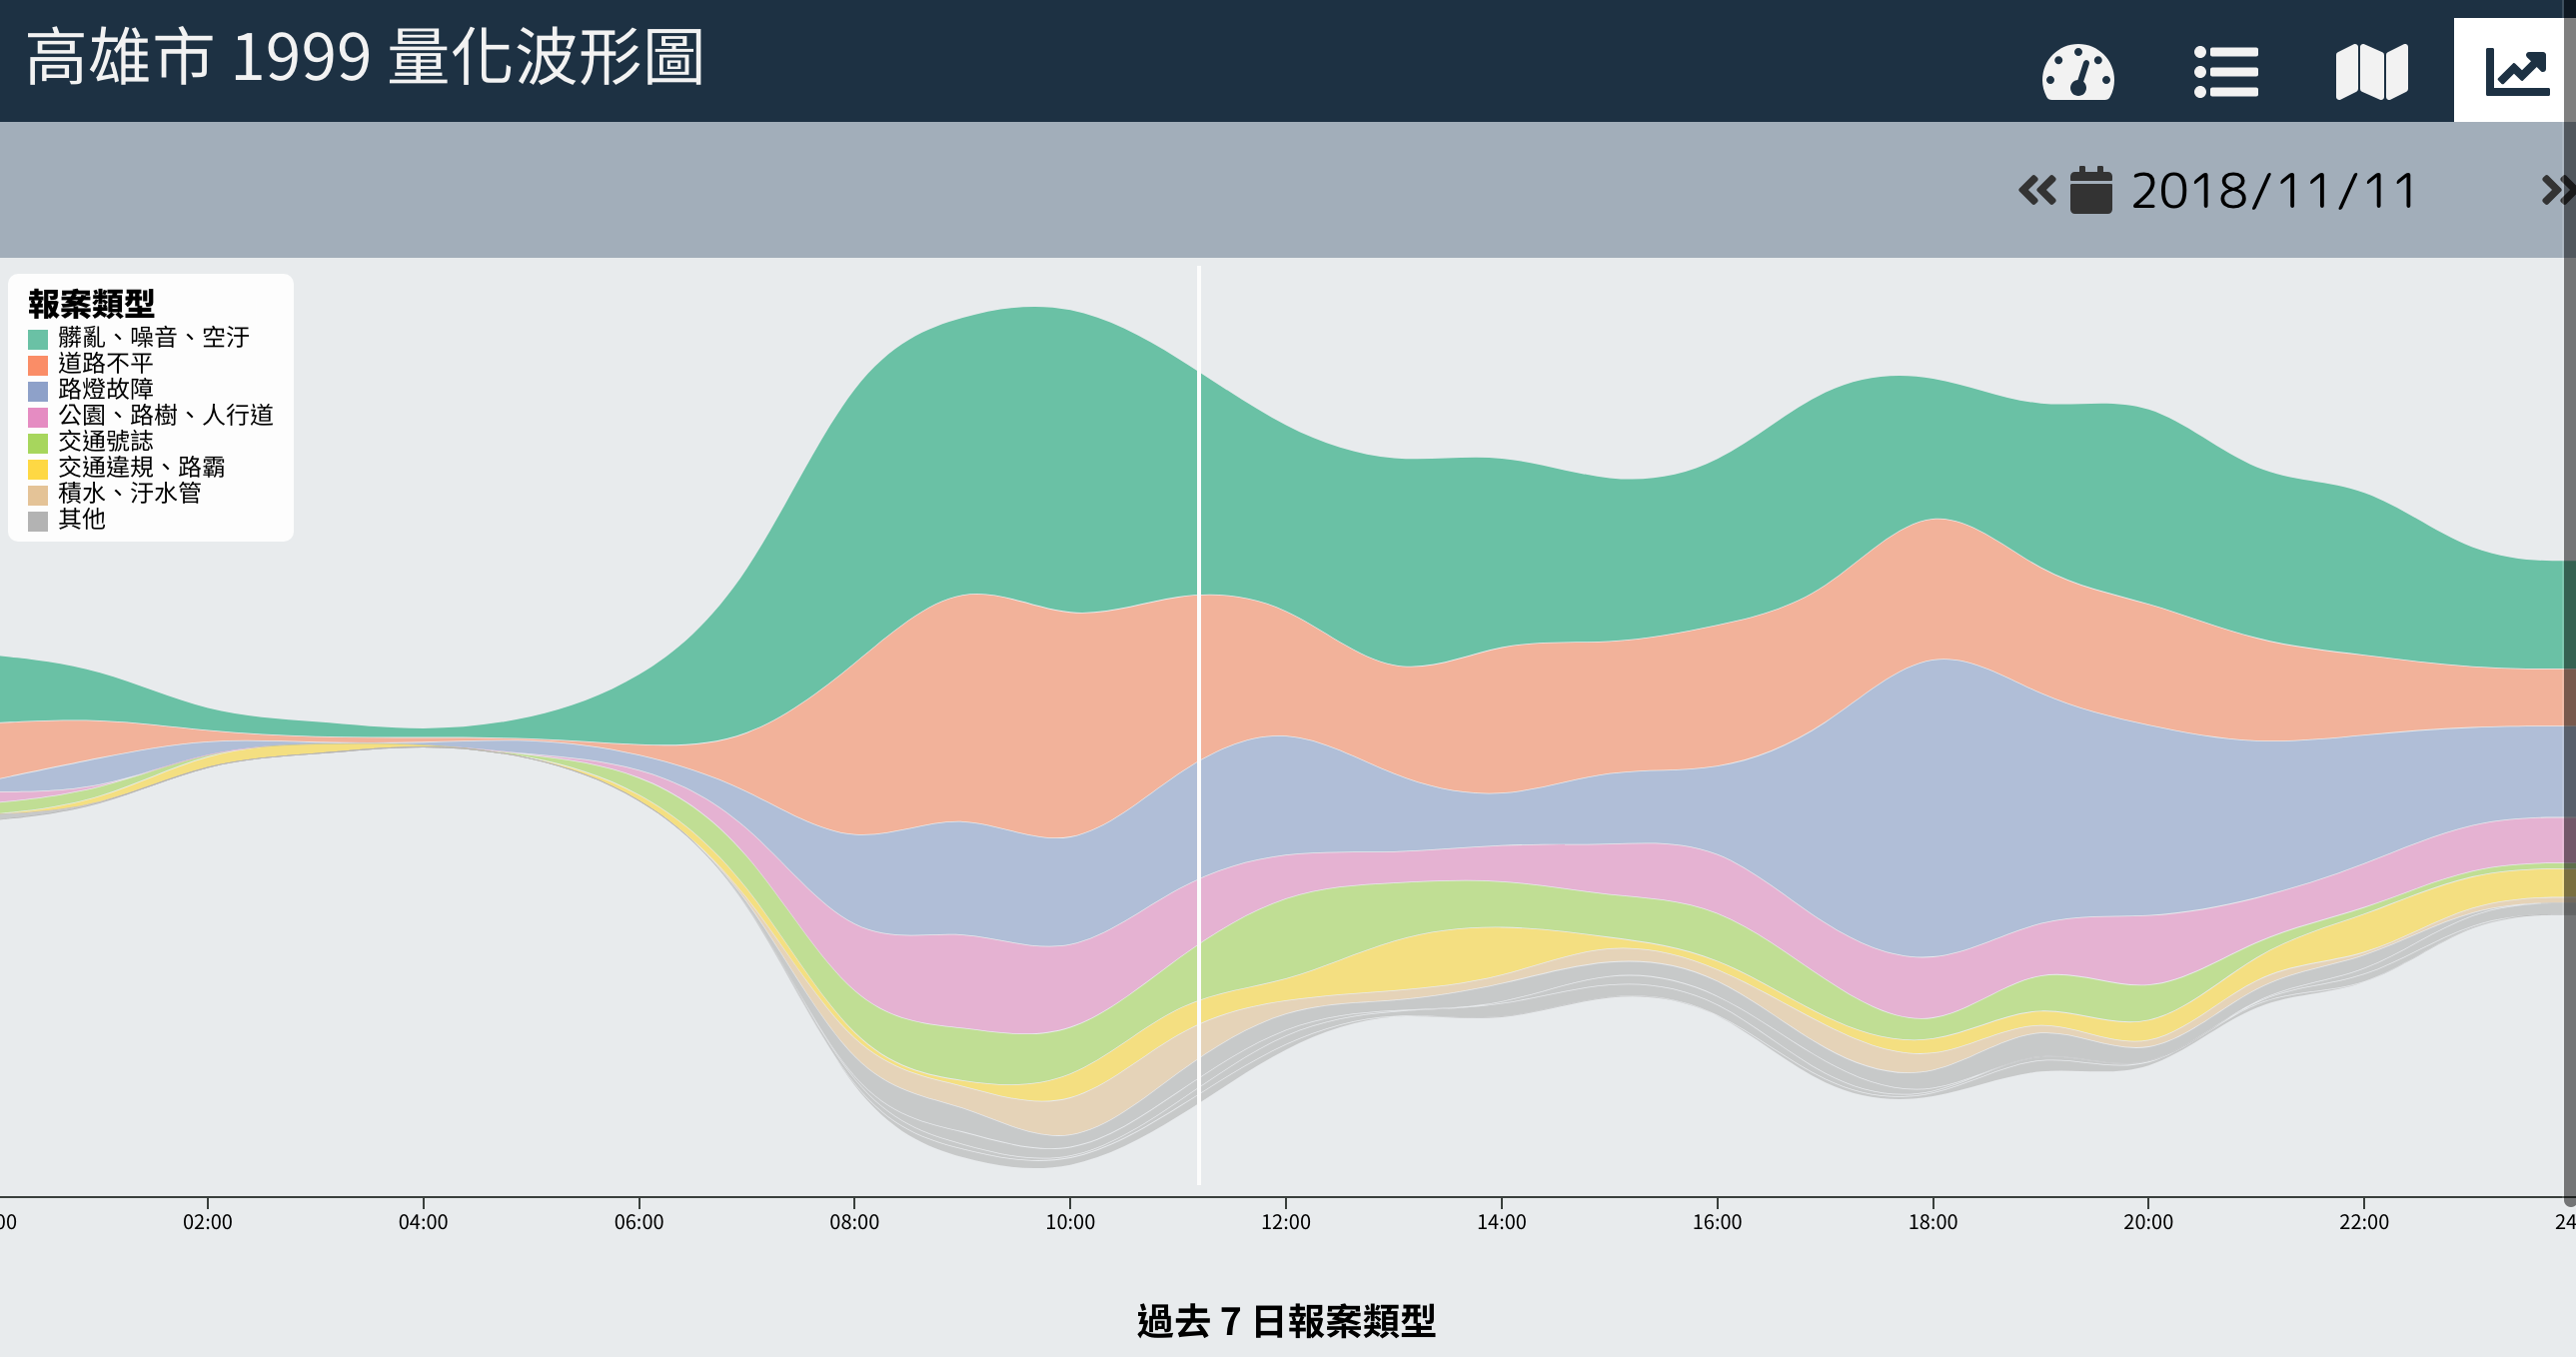
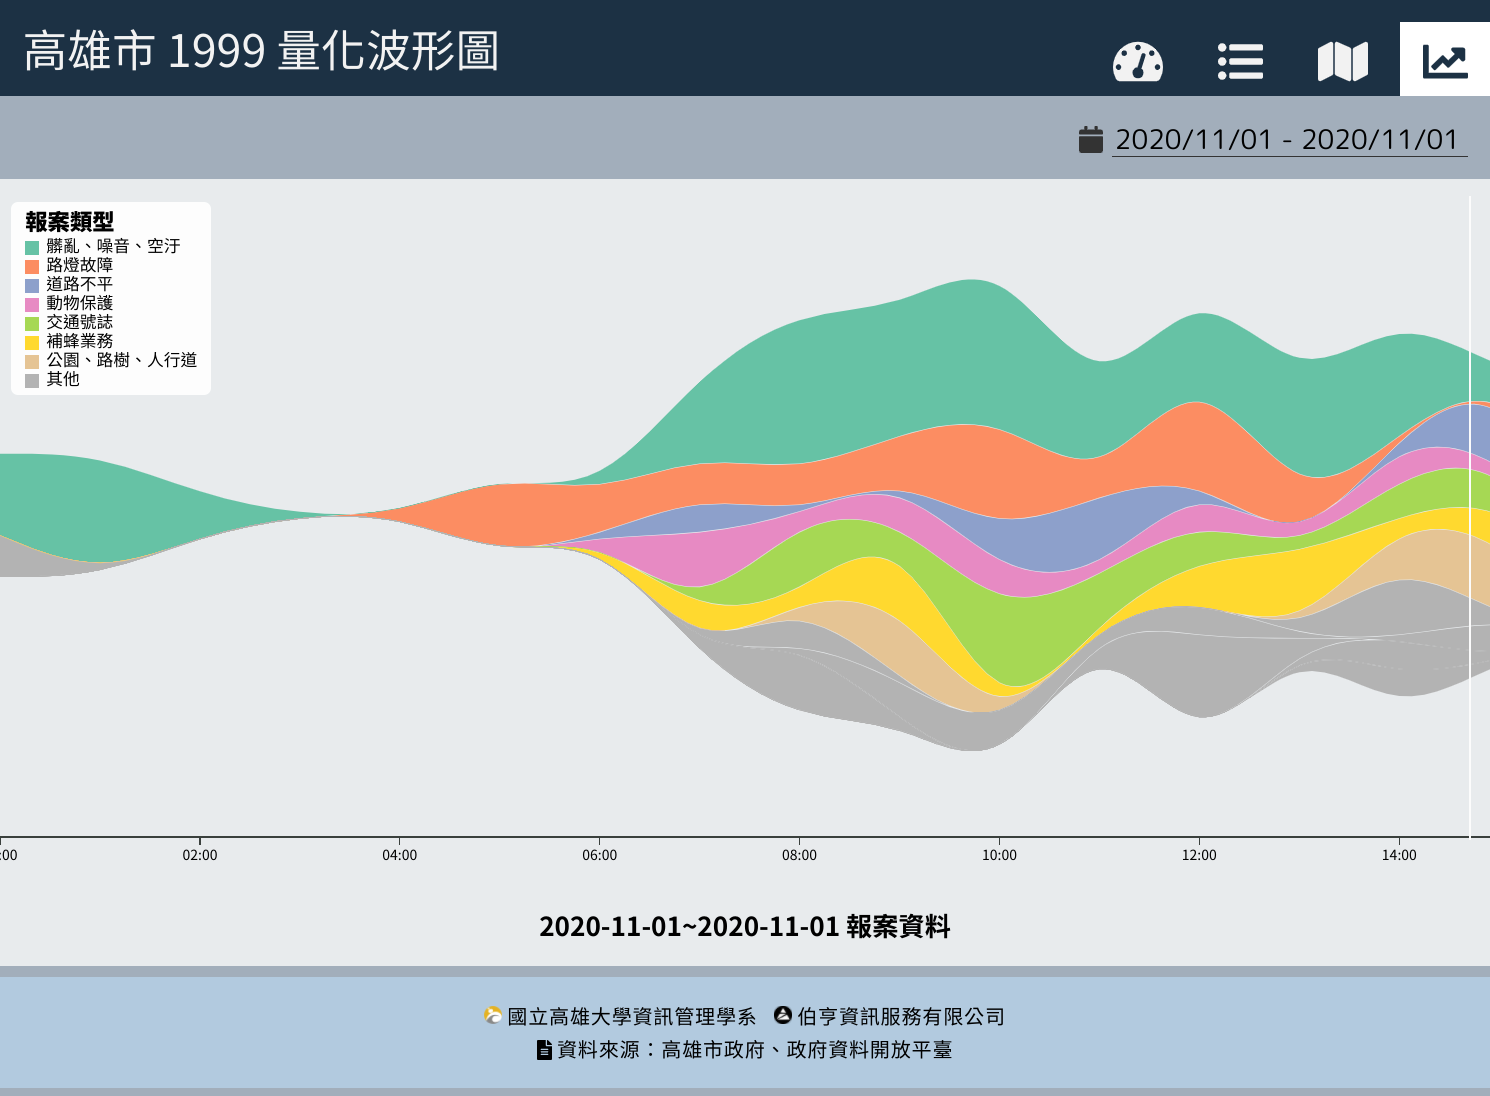
“Time and Space Distribution of Reporting” combines time and space, the cases are shown repeatedly over time in the form of a map, and the quantitative waveform graph is to stack the types of cases on the time axis to help the city to see the spread and distribution of cases, and also to provide city the reference of manpower deployment in various periods.
This service system uses a line chart to present the real-time reported cases of the day, and combines the map heat sensitivity to observe the density of reported cases in the area.
The report overview updates the reported cases in real time, reflecting the progress of the case (color block on the left), and then calculates the deregulation rate of the case on the day based on the completion of the reported case.
“Time and Space Distribution of Reporting” combines time and space, the cases are shown repeatedly over time in the form of a map, and the quantitative waveform graph is to stack the types of cases on the time axis to help the city to see the spread and distribution of cases, and also to provide city the reference of manpower deployment in various periods.
| Email: service@bhis.com.tw Website: https://www.bhis.com.tw/contact |